to Former page to Next page
2.2.b The result of infrared spectroscopic analysis
The graph shown in Fig.11 is a result of FT-IR on substances those float on the surface.
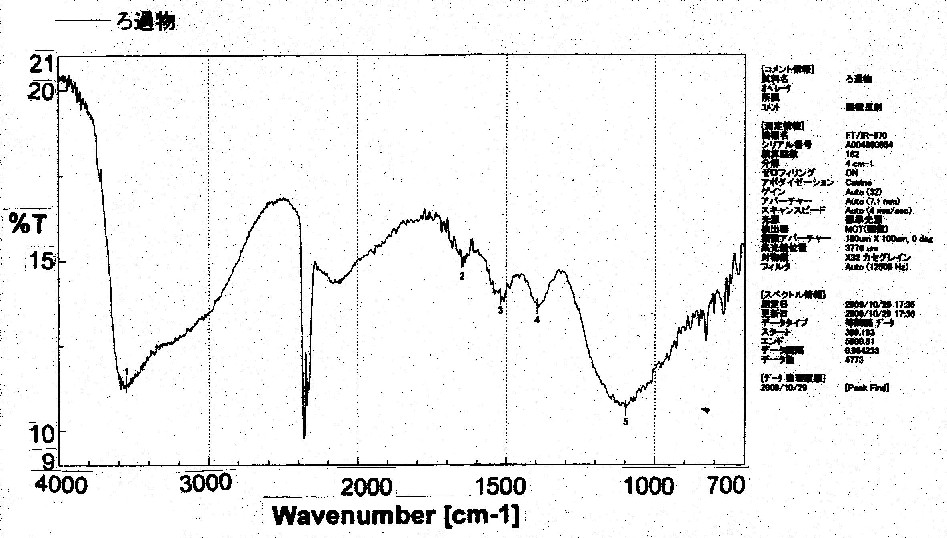
Fig.11 Result of FT-IR on the floating substances (after 1 week from the mixing)
Fig.12 is result of FT-IR on floating substances. As the results, we can not find out remarkable absorption peak that identifies C-H types of chemical bonds. There is absorption in nearly 4000 cm-1 wave numbers that is short of wavelength area on the substance on the glass wall. The fact means that there are hard bonds in the membrane on the grass wall.
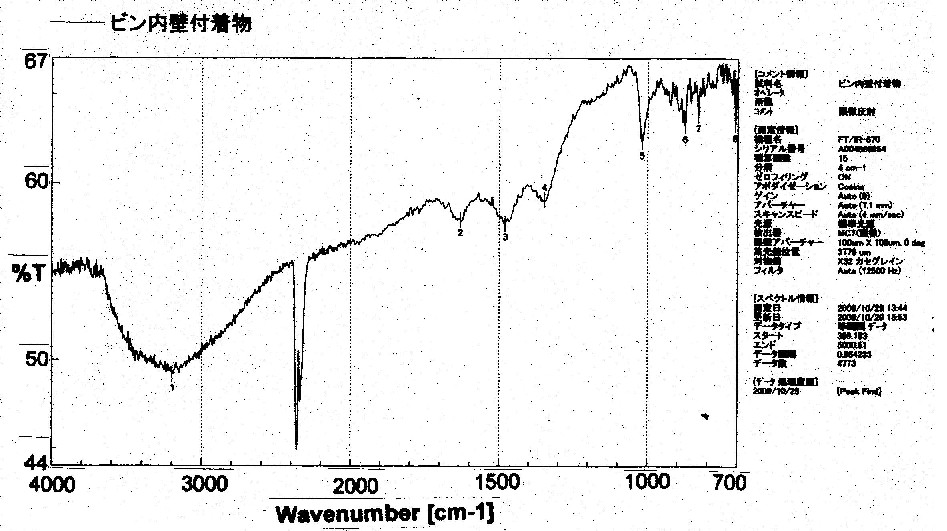
Fig.12 Result of FT-IR on the substances (on glass wall, after 1 week from the mixing)
-2.3- to Index